How it works
Trigger
An automation runs on its schedule (e.g. 09:00 every morning) or when an alert matches its filter rules.
Investigate
Foggy runs the investigation using your connected data sources — querying metrics, logs, dashboards, and cluster state, just like a manual investigation.
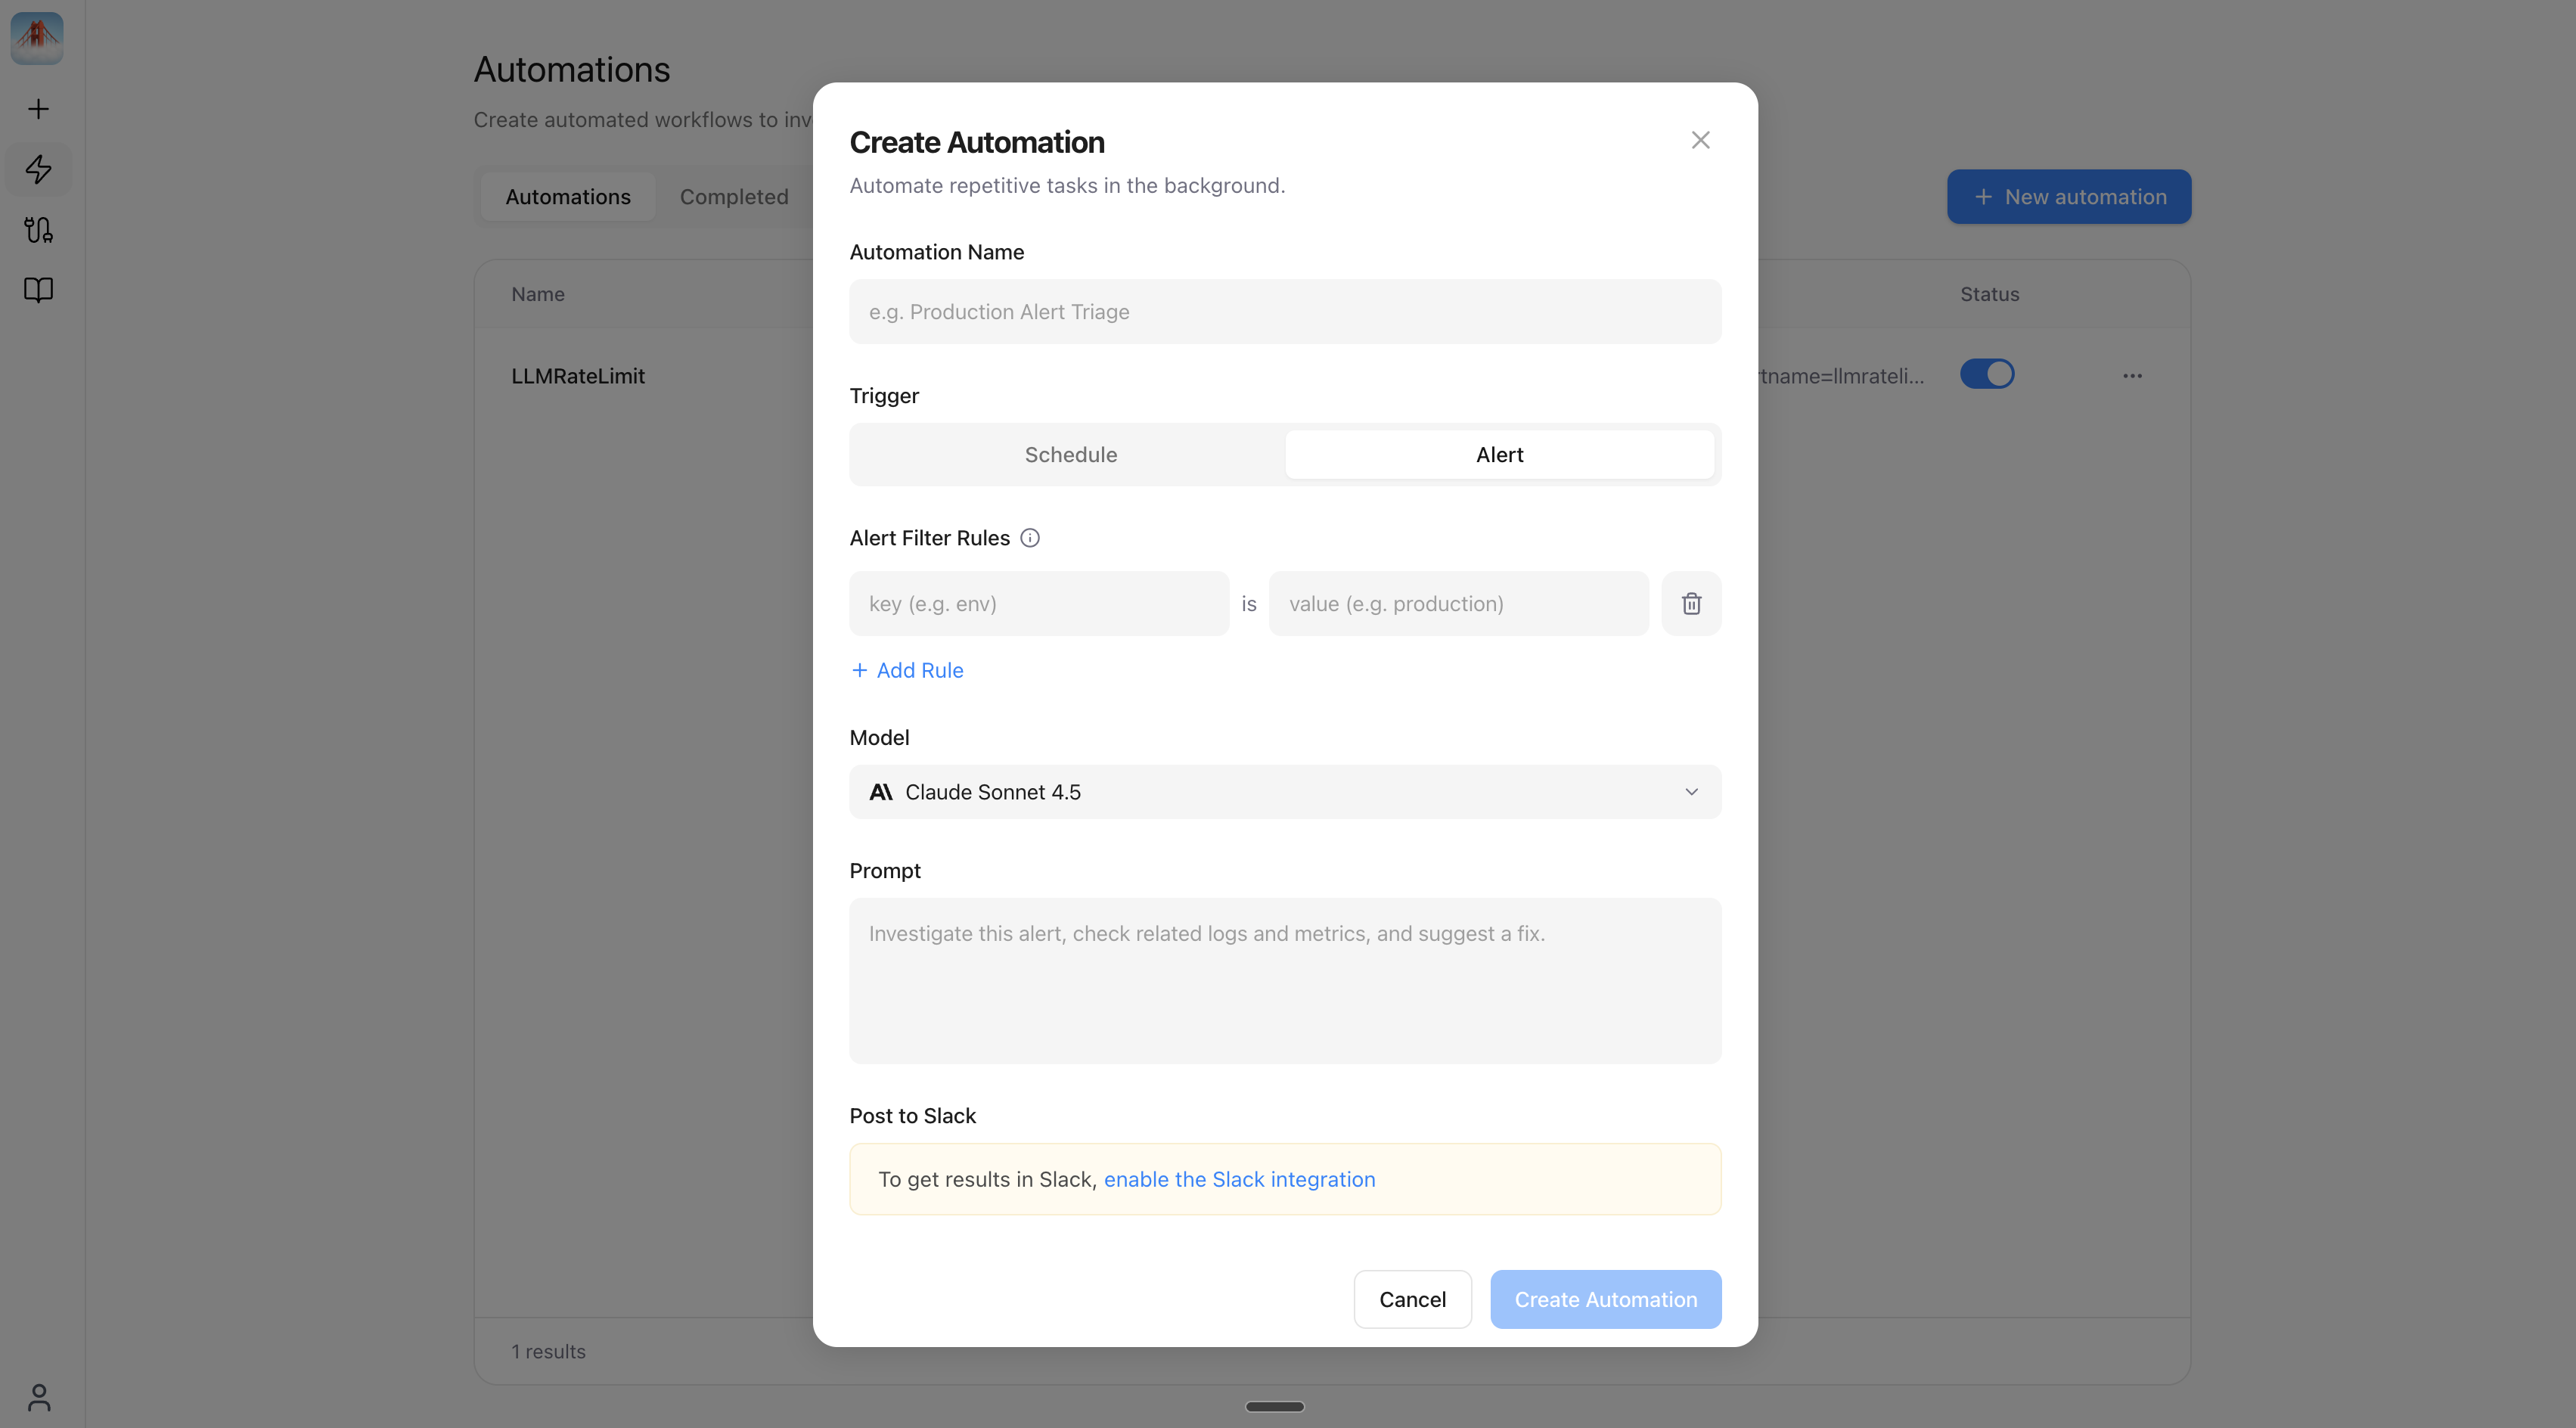
Alert-triggered automations
Configure automations that fire when alerts come in. Define filter rules to control which alerts trigger investigations.Filter rules
Filter rules match against alert labels. Multiple rules use AND logic — all must match for the automation to trigger. Common patterns:| Pattern | Filter rules | Use case |
|---|---|---|
| Critical only | severity = critical | Investigate only high-impact alerts |
| Service-scoped | severity = critical + service = checkout | Focus on a specific service |
| Namespace | namespace = production | Ignore staging/dev alerts |
| Broad triage | alertname = HighErrorRate | Auto-investigate a specific alert type |
Run now
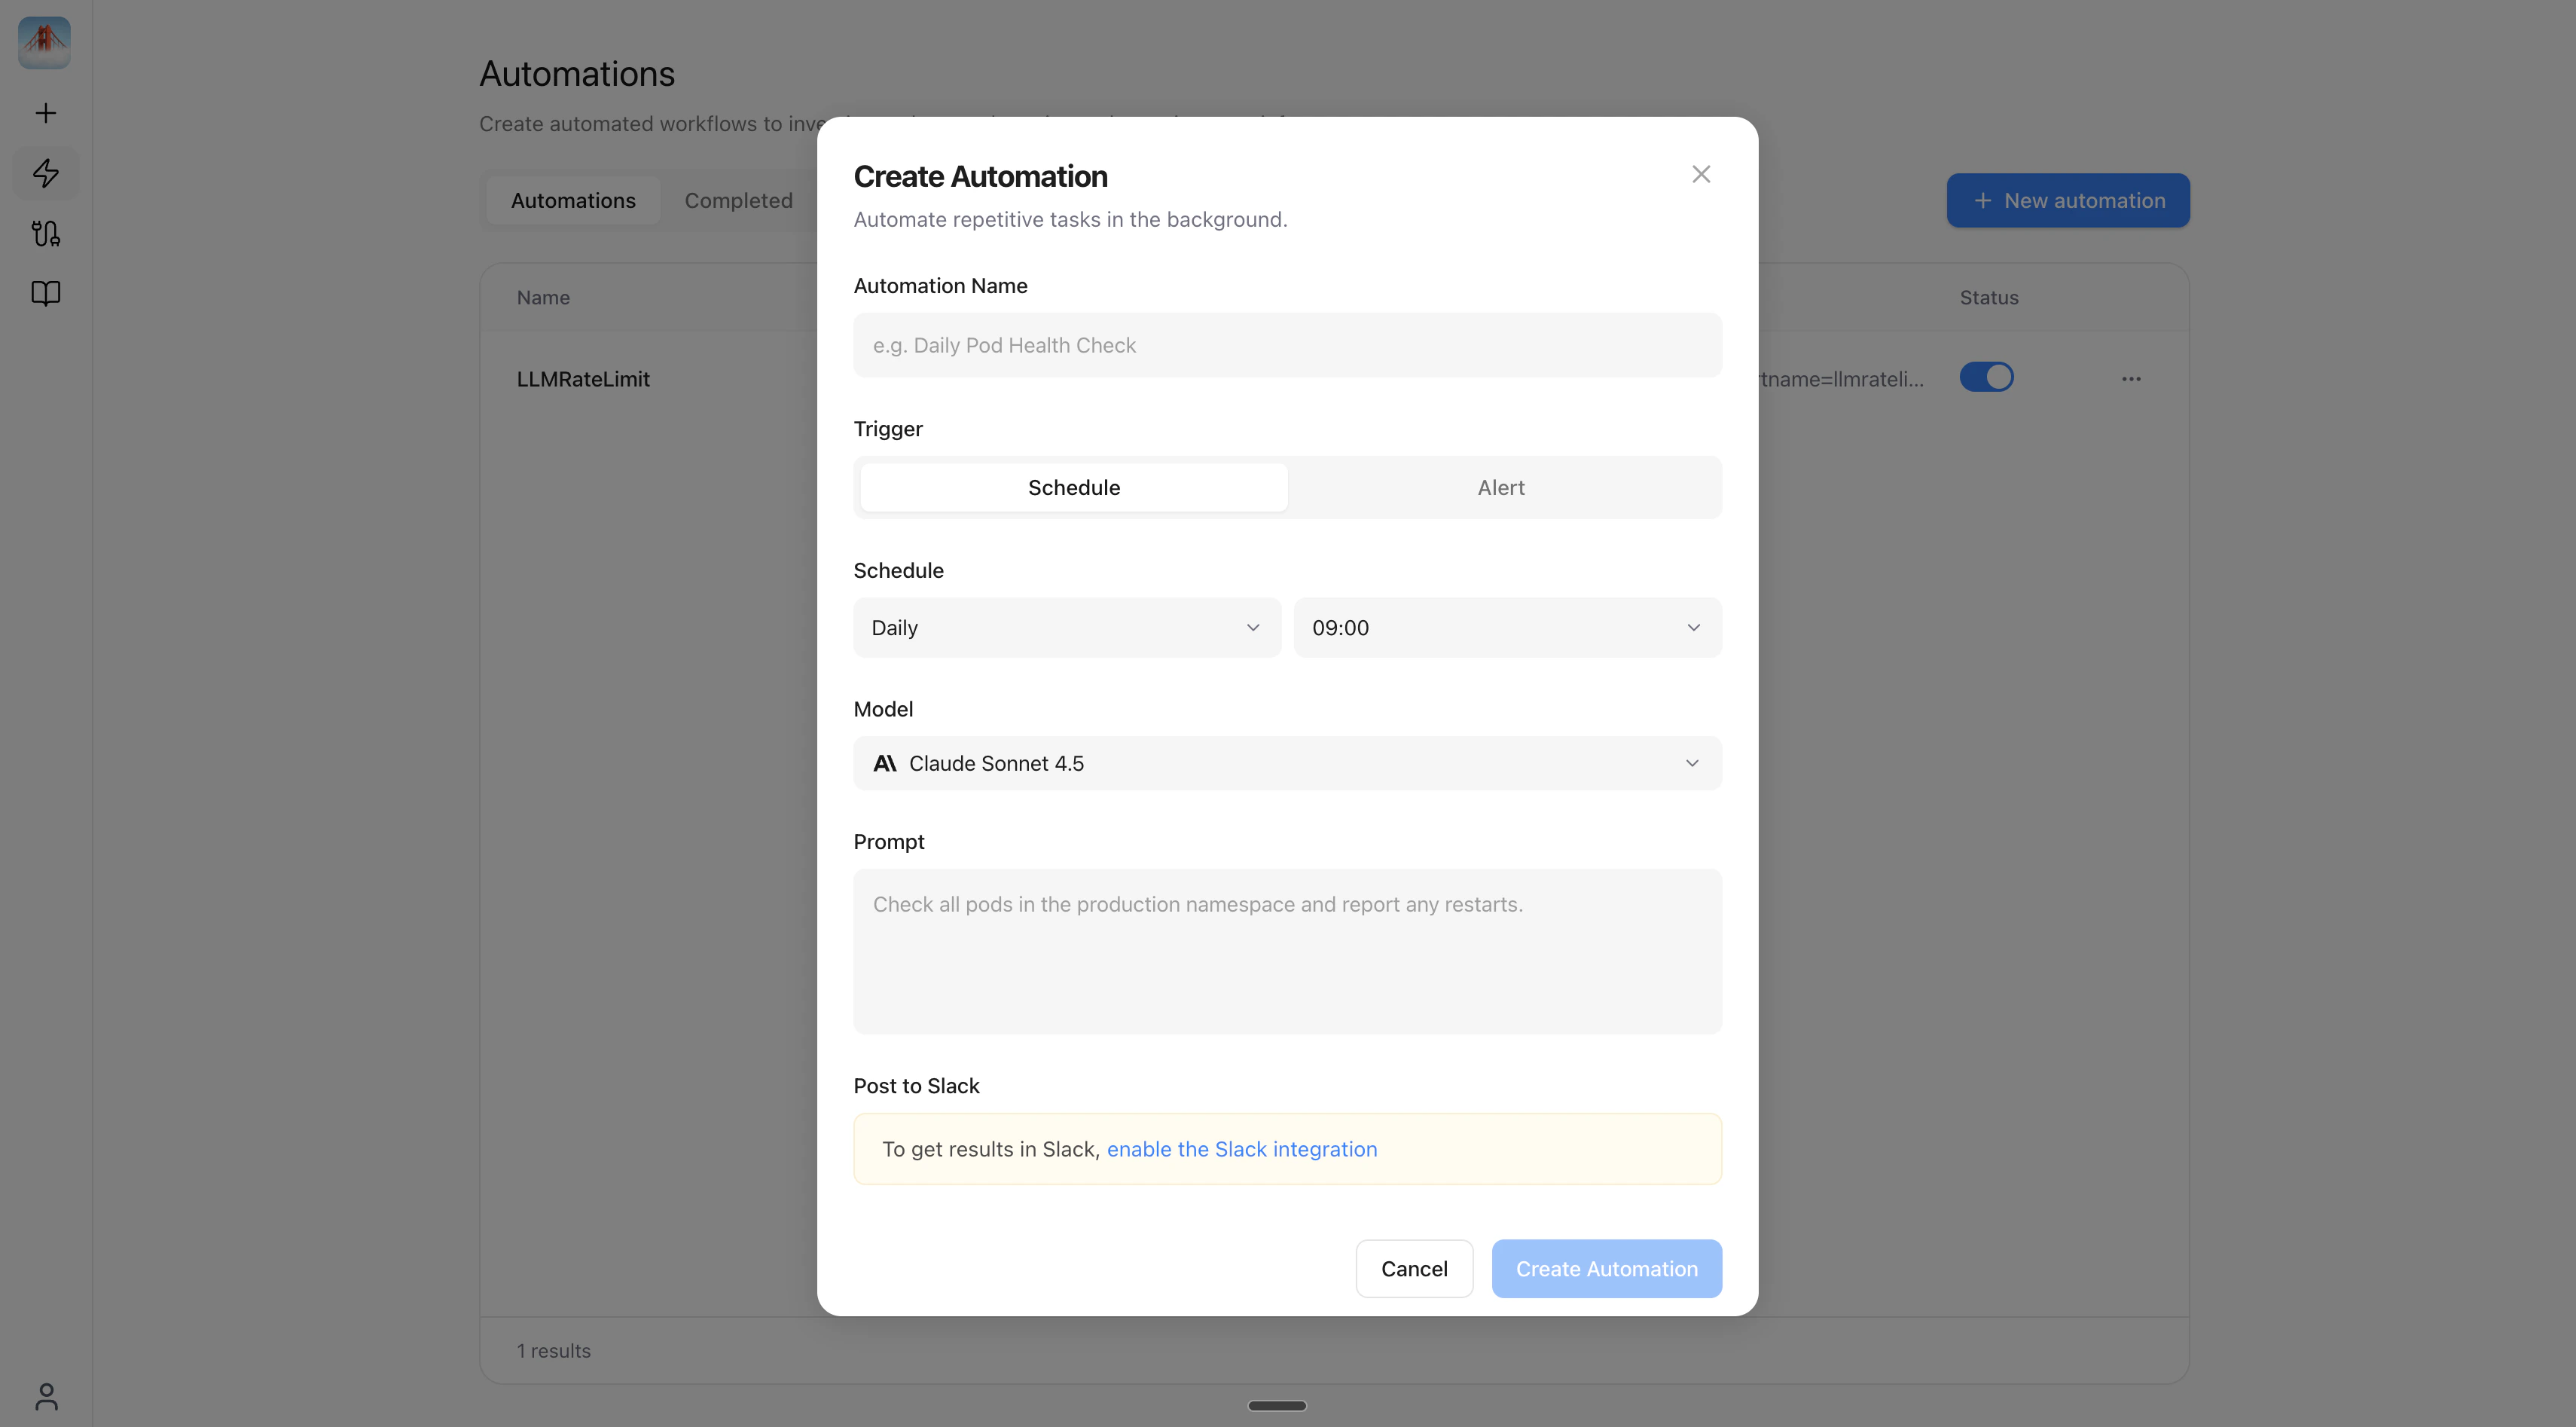
Every automation — scheduled or alert-triggered — has a Run now button on its detail page. This executes the automation immediately against live data, independent of its schedule or filter rules. Useful for testing a new automation, or to re-run one after fixing a connector.Scheduled automations
Set up investigations that run on a recurring schedule — no alerts required.| Frequency | Configuration |
|---|---|
| Daily | Runs every day at selected times |
| Weekly | Select specific days (e.g. Mon, Wed, Fri) and times |
| Monthly | Select specific days of the month (1–31) and times |
| One-time | Pick a specific date and time for a single run |
Next steps
Slack Bot
Investigate incidents and get automation results directly in Slack.
Knowledge Base
Add runbooks and context so Foggy gives more accurate answers.
Connect data sources
Add Grafana, Kubernetes, and more to power investigations.