> ## Documentation Index
> Fetch the complete documentation index at: https://docs.foggyhq.com/llms.txt
> Use this file to discover all available pages before exploring further.
# Quick Start
> Your first AI SRE investigation in under 5 minutes.
## Step 1: Sign up
Create an account at [foggyhq.com](https://foggyhq.com). You'll be in the web interface immediately — no infrastructure to set up, nothing to install.
## Step 2: Connect your first data source
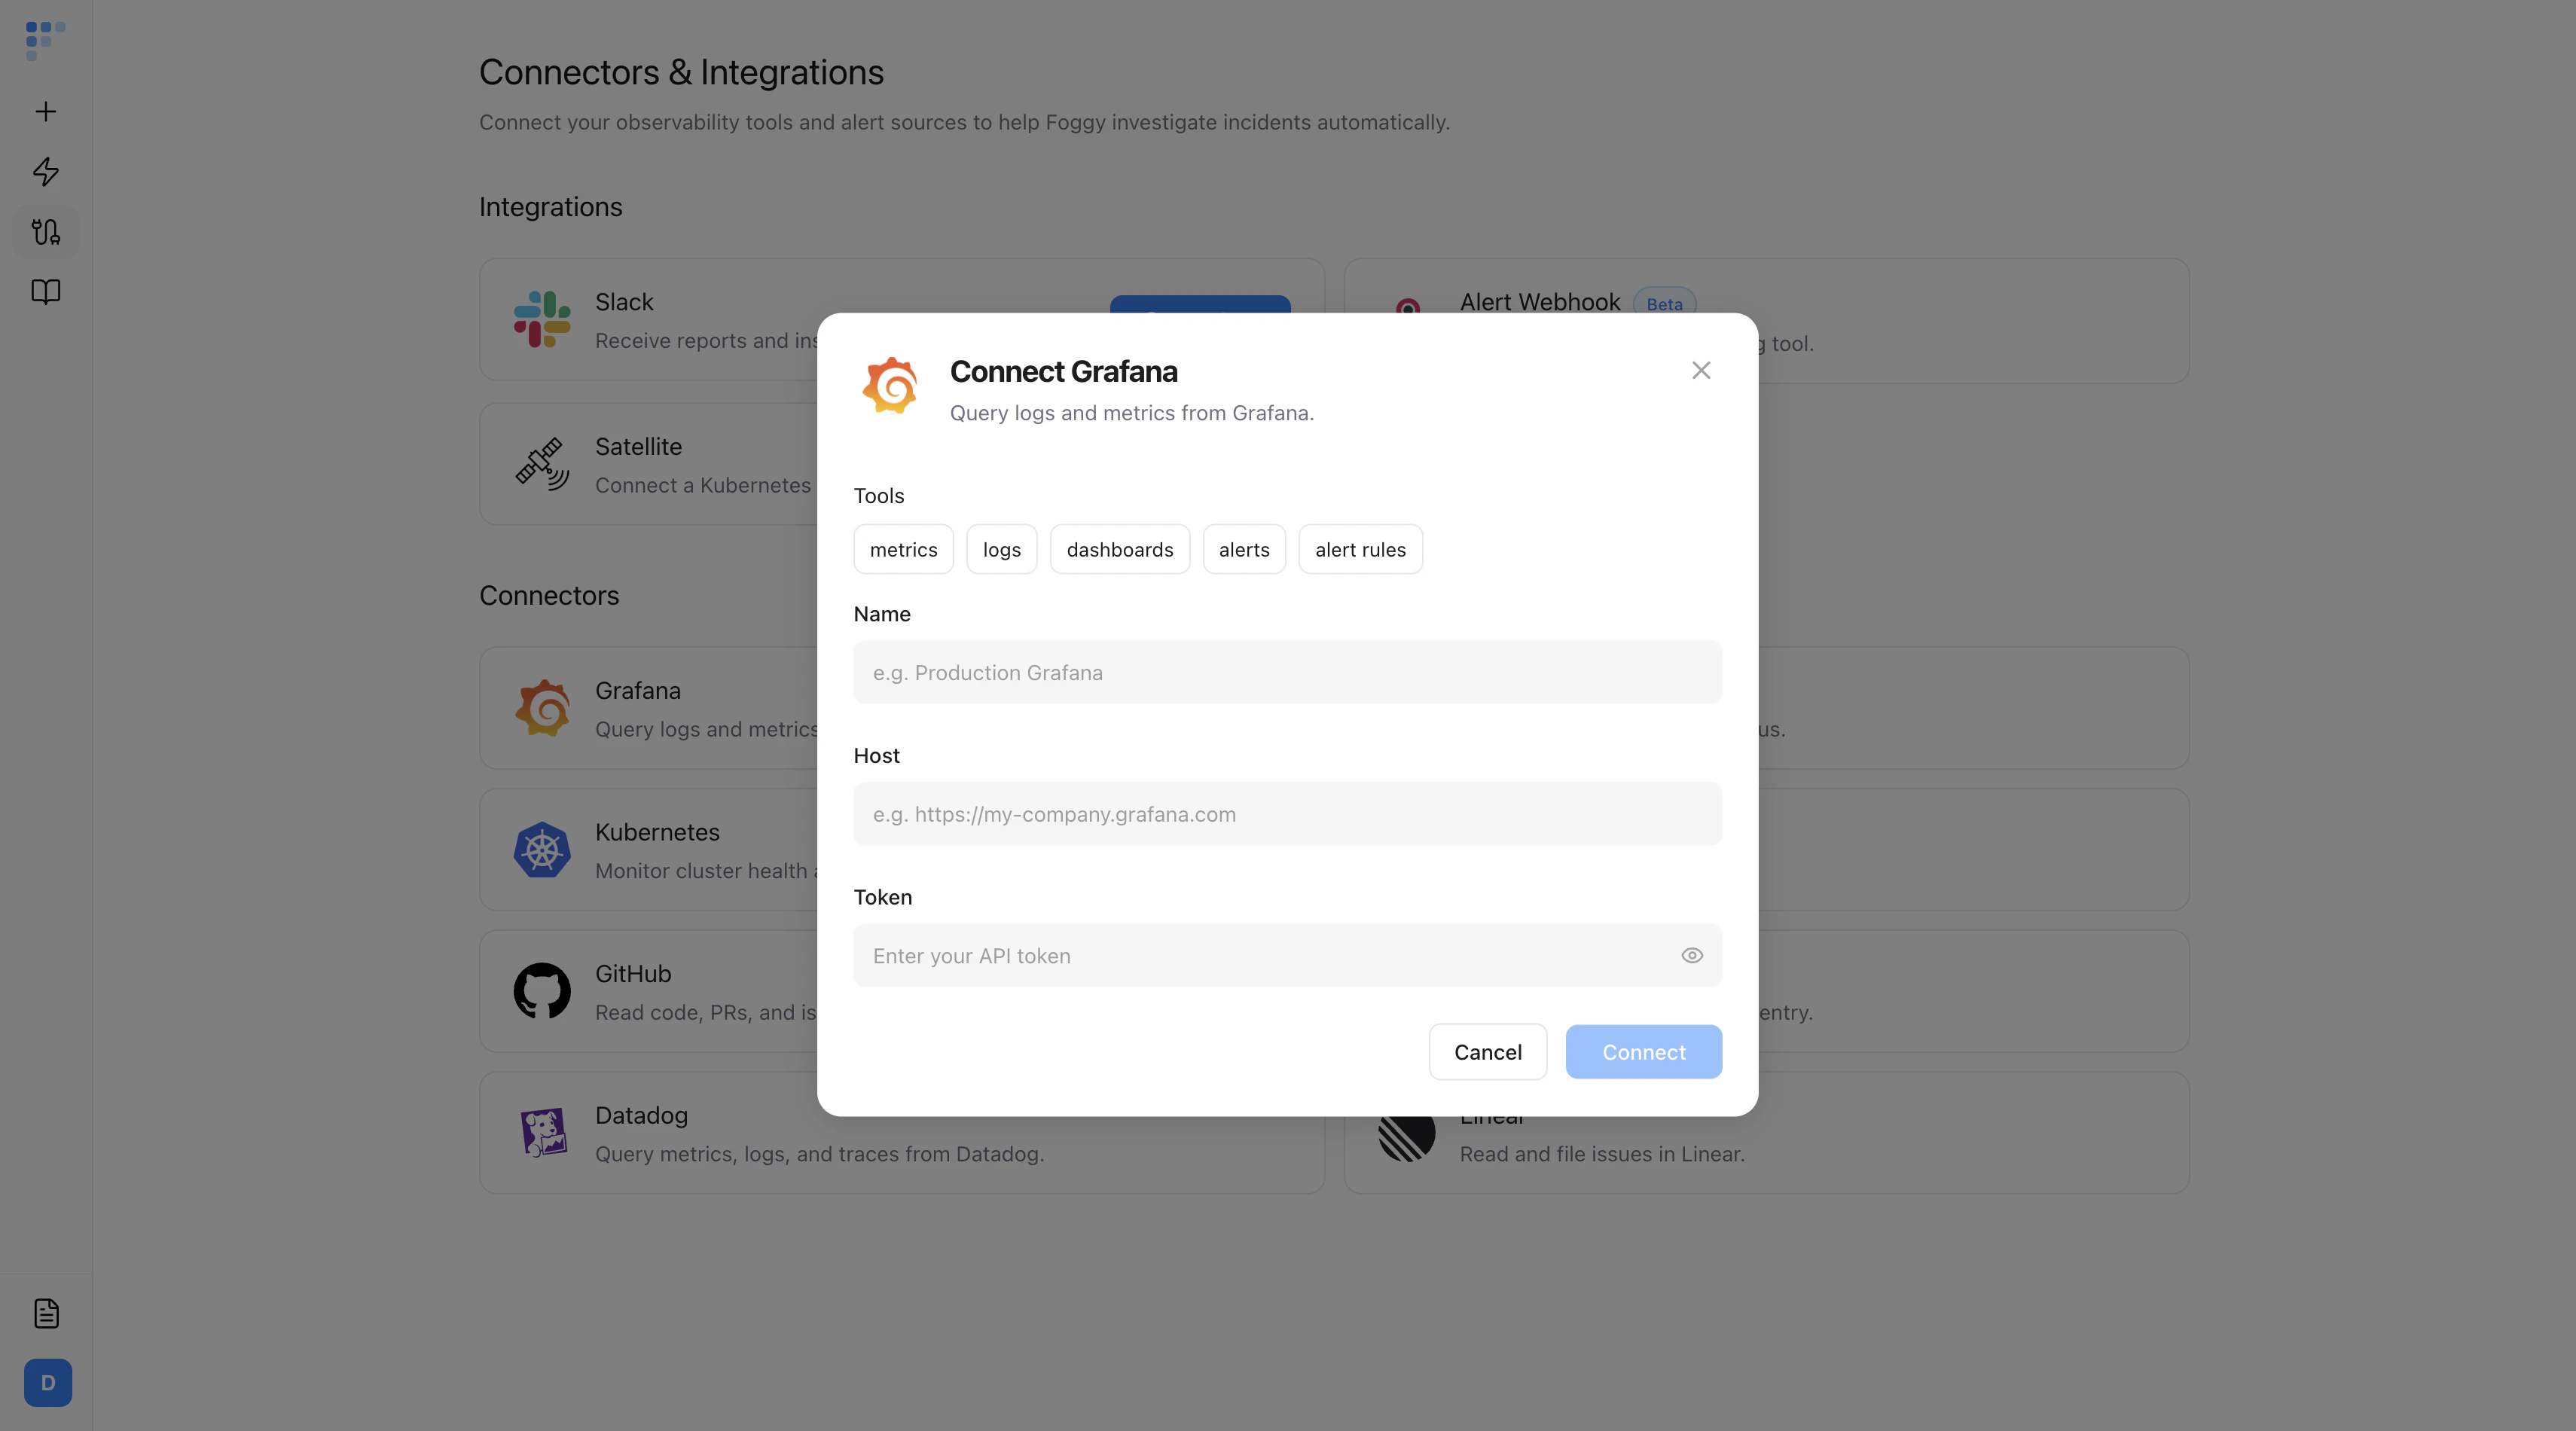
Navigate to **Connectors** in the sidebar and click **Add Connector**. Start with Grafana — it's the fastest to set up:
1. Select **Grafana**
2. Enter a name (e.g. "Production Grafana")
3. Enter your Grafana Host URL (e.g. `https://my-company.grafana.com`)
4. Optionally add an API token for authenticated access
5. Click **Save**
Foggy will immediately discover available dashboards and data sources.
Foggy uses **read-only access**. It queries your tools but never modifies your infrastructure.
 ## Step 3: Run your first investigation
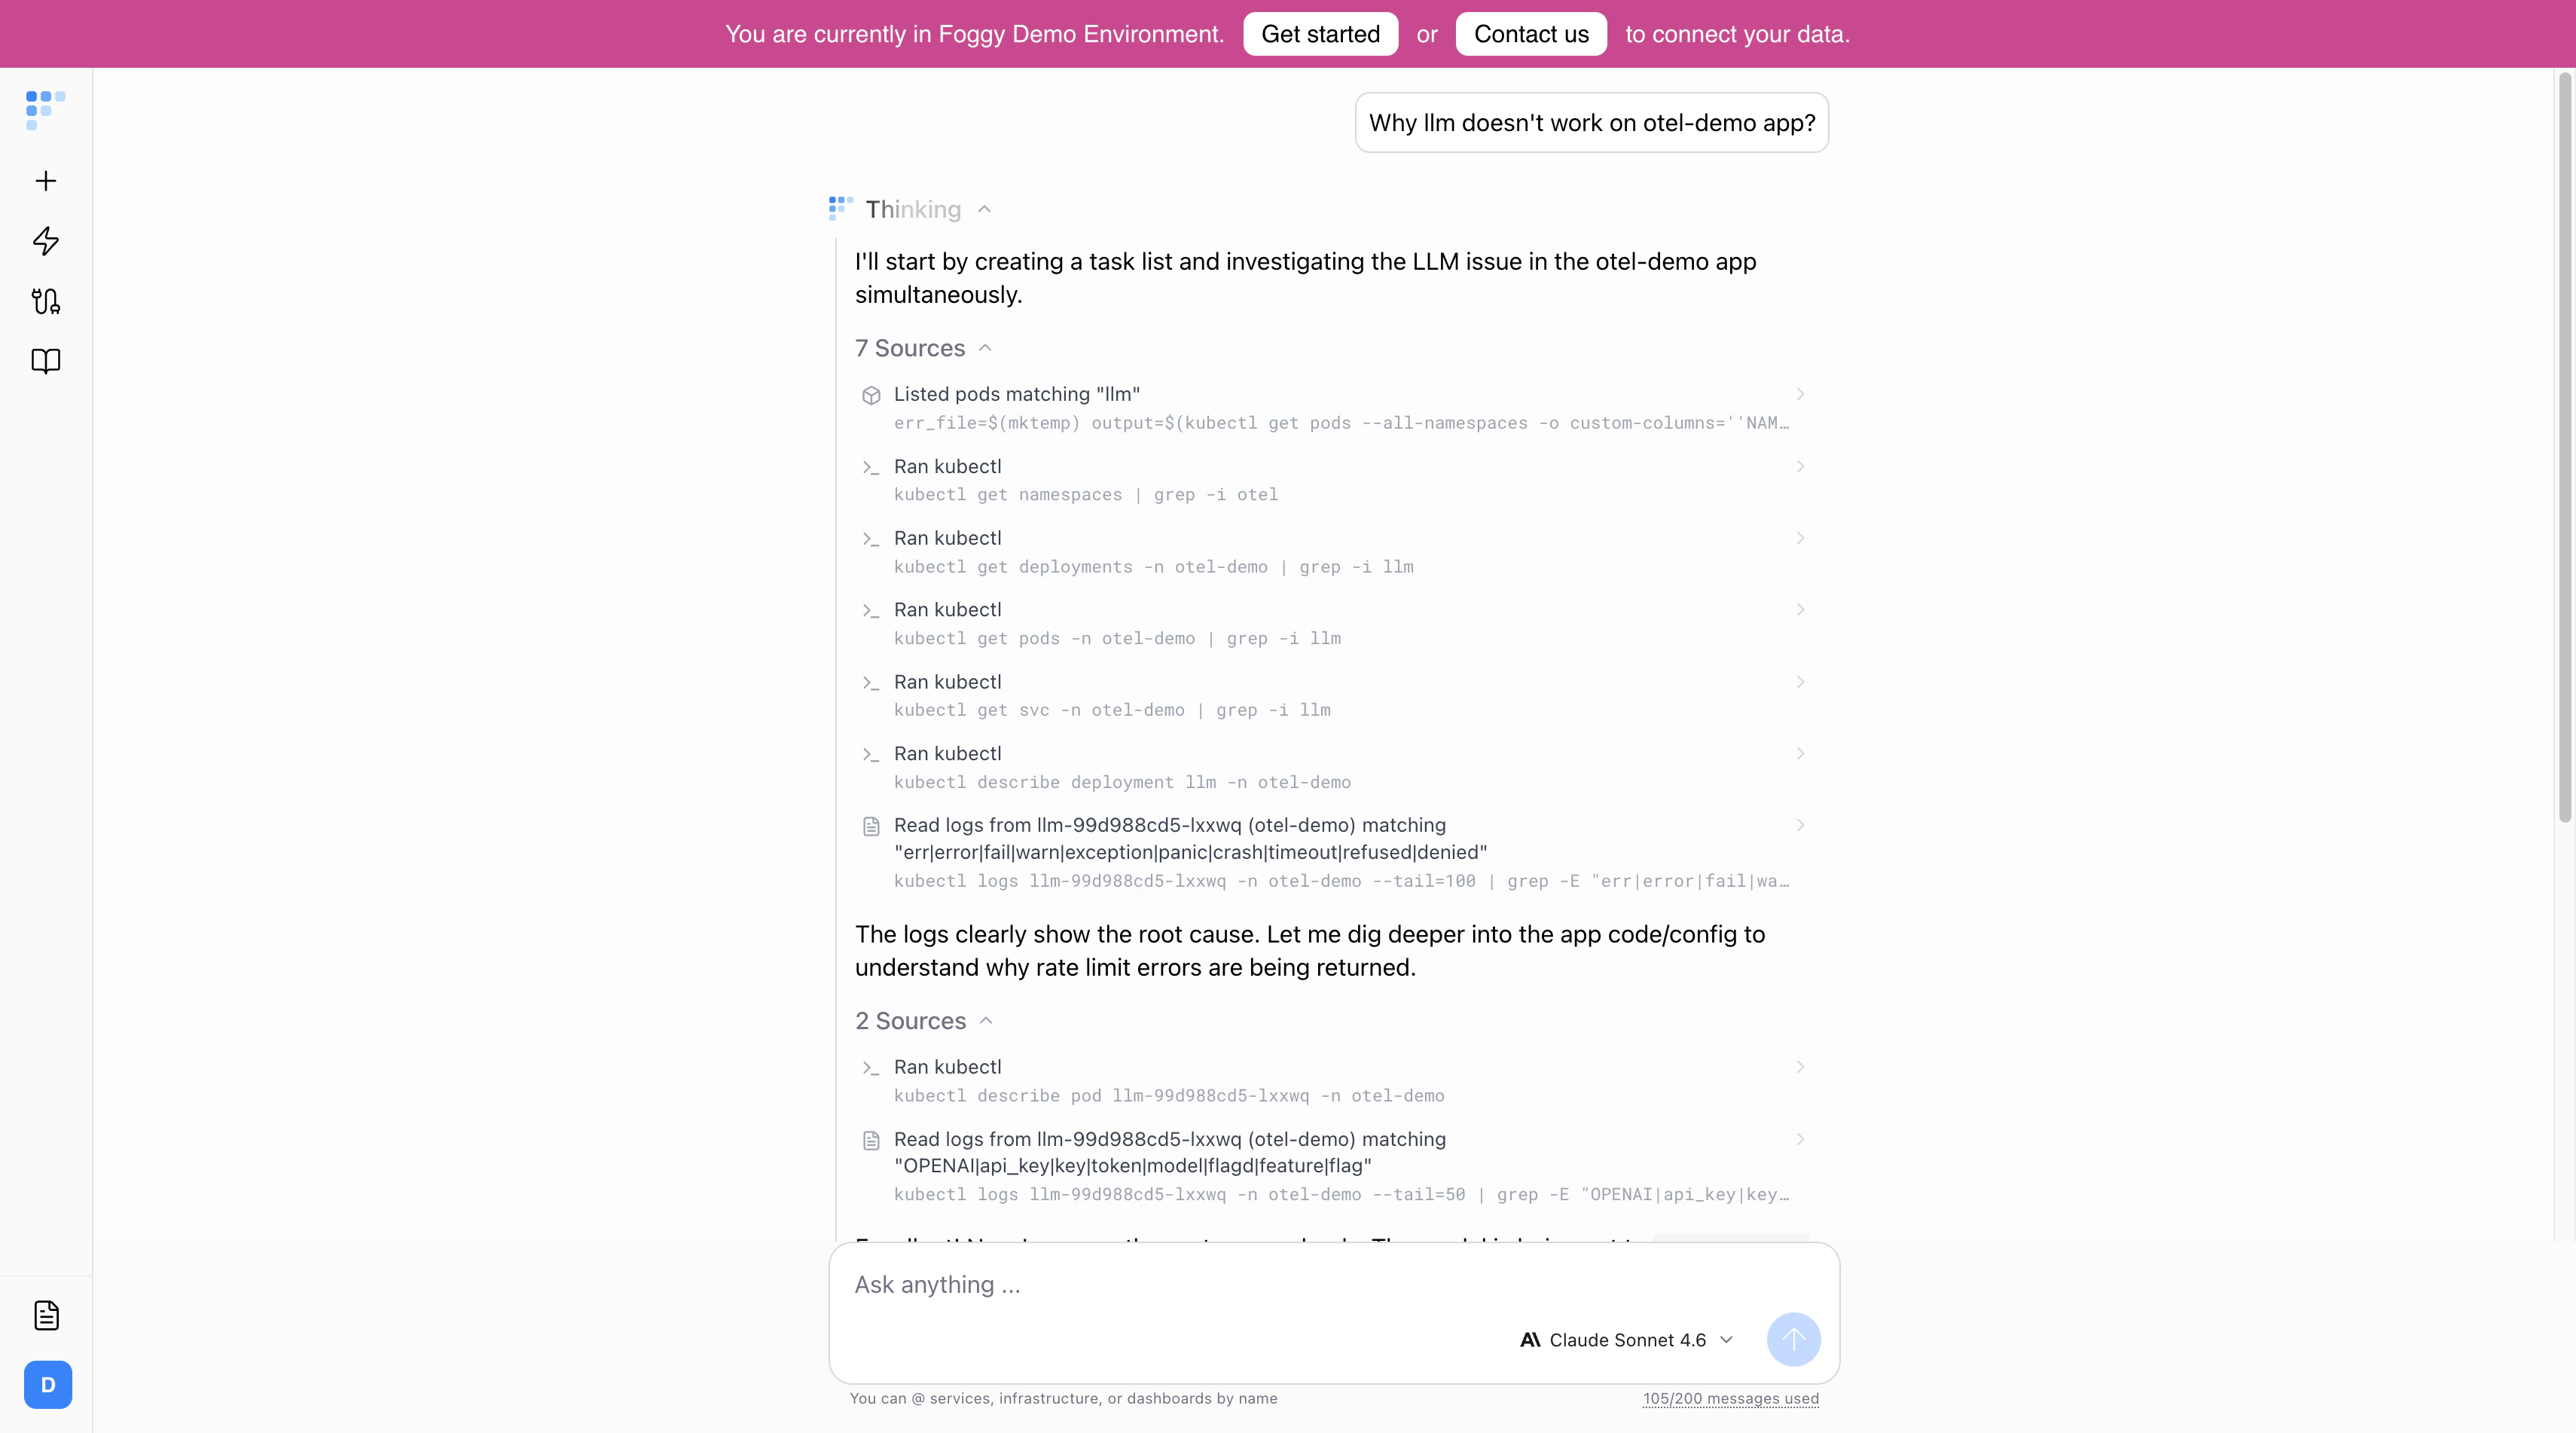
Go to the chat and ask a question. The best prompts include:
* **Service or component name** — "checkout service", "API gateway", "kube-system namespace"
* **Time window** — "last 2 hours", "since yesterday 3pm", "this week"
* **Symptom or metric** — "5xx errors", "high latency", "OOMKills", "pod restarts"
Foggy streams its reasoning in real time — you'll see the chain-of-thought panel update as it queries your systems. Simple questions take 10–30 seconds. Complex multi-tool investigations take 1–3 minutes.
## Step 3: Run your first investigation
Go to the chat and ask a question. The best prompts include:
* **Service or component name** — "checkout service", "API gateway", "kube-system namespace"
* **Time window** — "last 2 hours", "since yesterday 3pm", "this week"
* **Symptom or metric** — "5xx errors", "high latency", "OOMKills", "pod restarts"
Foggy streams its reasoning in real time — you'll see the chain-of-thought panel update as it queries your systems. Simple questions take 10–30 seconds. Complex multi-tool investigations take 1–3 minutes.
 ## Step 4: Explore the results
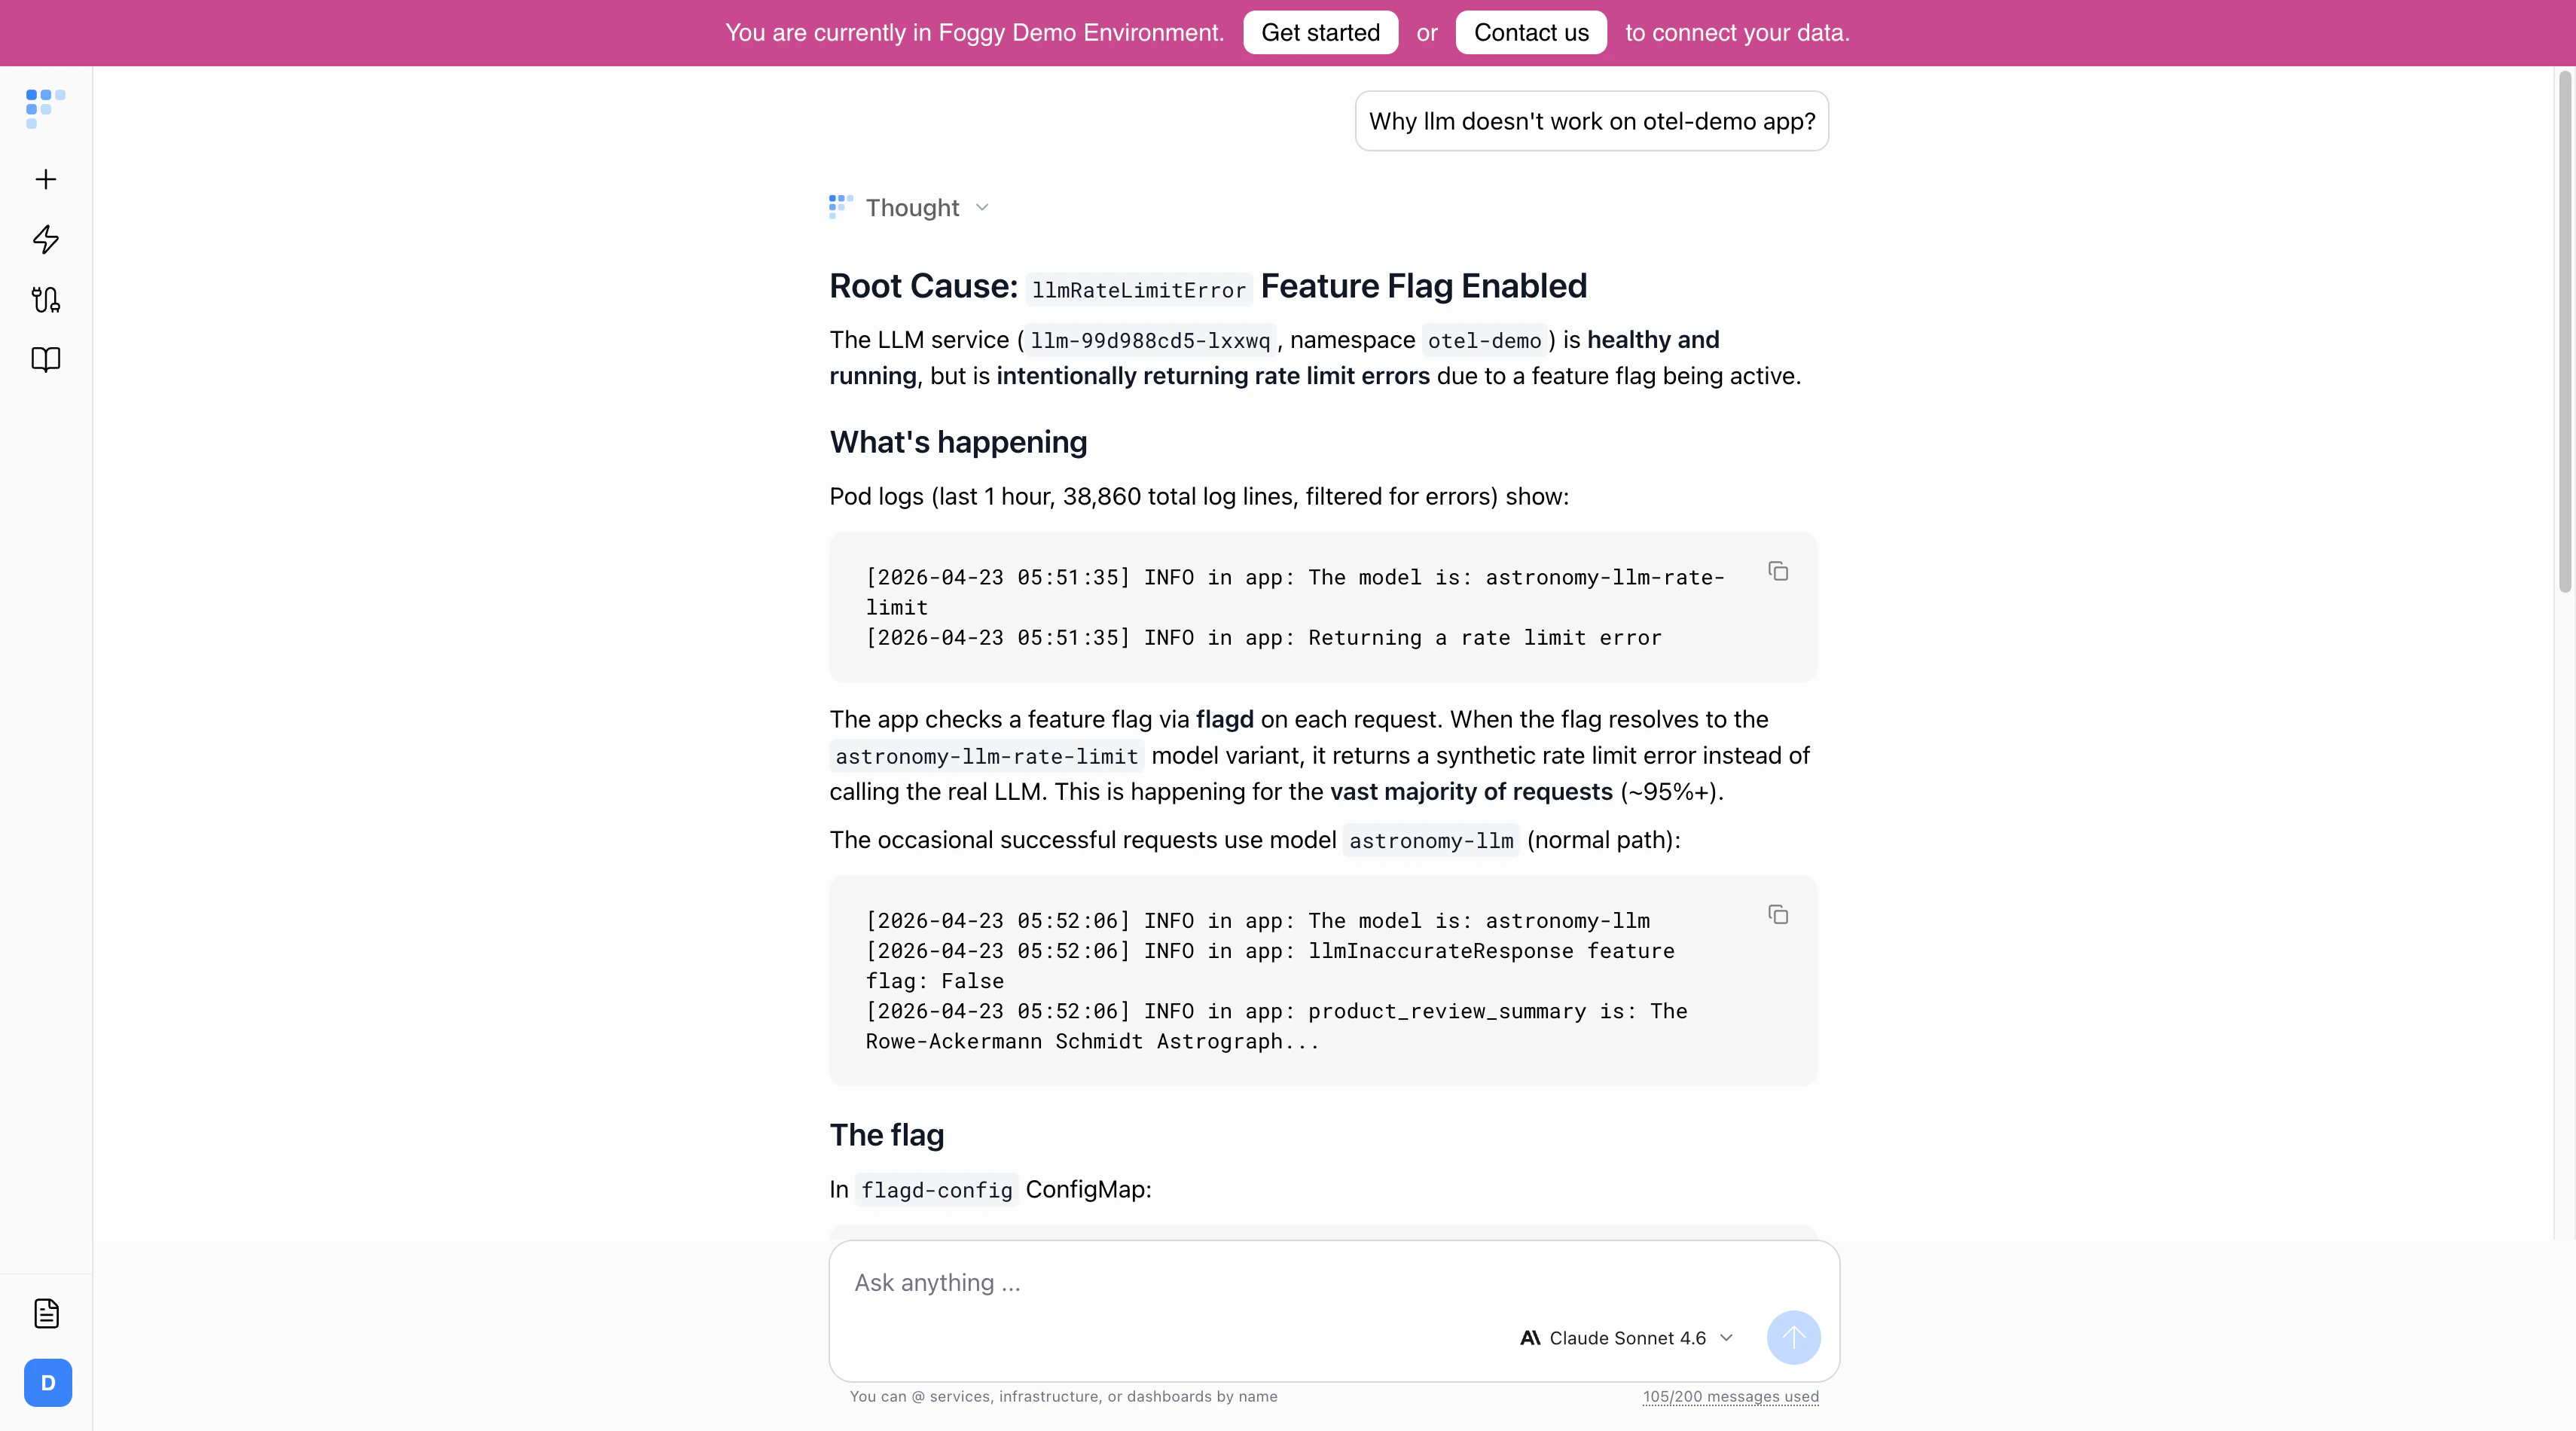
* **Chain-of-thought** — Expand to see every tool call, query, and reasoning step Foggy took.
* **Sources** — See which Grafana dashboards, Prometheus queries, or log searches were used as evidence.
* **Follow-up suggestions** — Click to dig deeper into any finding, or ask your own follow-up question. Foggy remembers context within the thread, so follow-ups get progressively more targeted.
## Step 4: Explore the results
* **Chain-of-thought** — Expand to see every tool call, query, and reasoning step Foggy took.
* **Sources** — See which Grafana dashboards, Prometheus queries, or log searches were used as evidence.
* **Follow-up suggestions** — Click to dig deeper into any finding, or ask your own follow-up question. Foggy remembers context within the thread, so follow-ups get progressively more targeted.
 ## Step 5: Go further
Connect Kubernetes, Slack, and alert sources for cross-stack investigations.
Schedule recurring investigations — daily health checks, weekend summaries, or alert-triggered root cause analysis.
Teach Foggy about your architecture, runbooks, and team ownership so it investigates with full context.
@mention Foggy in any channel to investigate. Results are delivered as threaded replies.
## Step 5: Go further
Connect Kubernetes, Slack, and alert sources for cross-stack investigations.
Schedule recurring investigations — daily health checks, weekend summaries, or alert-triggered root cause analysis.
Teach Foggy about your architecture, runbooks, and team ownership so it investigates with full context.
@mention Foggy in any channel to investigate. Results are delivered as threaded replies.