> ## Documentation Index
> Fetch the complete documentation index at: https://docs.foggyhq.com/llms.txt
> Use this file to discover all available pages before exploring further.
# Grafana
> Query dashboards, metrics, logs, and alerts from Grafana.
Connect Grafana to let Foggy query your dashboards, metrics, logs, alert states, and alert rules during investigations.
## What Foggy can do
| Tool | Description |
| --------------- | ------------------------------------------------ |
| **Metrics** | Query time-series data from Grafana data sources |
| **Logs** | Search log data via Grafana's log data sources |
| **Dashboards** | Read dashboard panels and their current state |
| **Alerts** | Check currently firing alerts and their details |
| **Alert rules** | Inspect alert rule definitions and thresholds |
## Setup
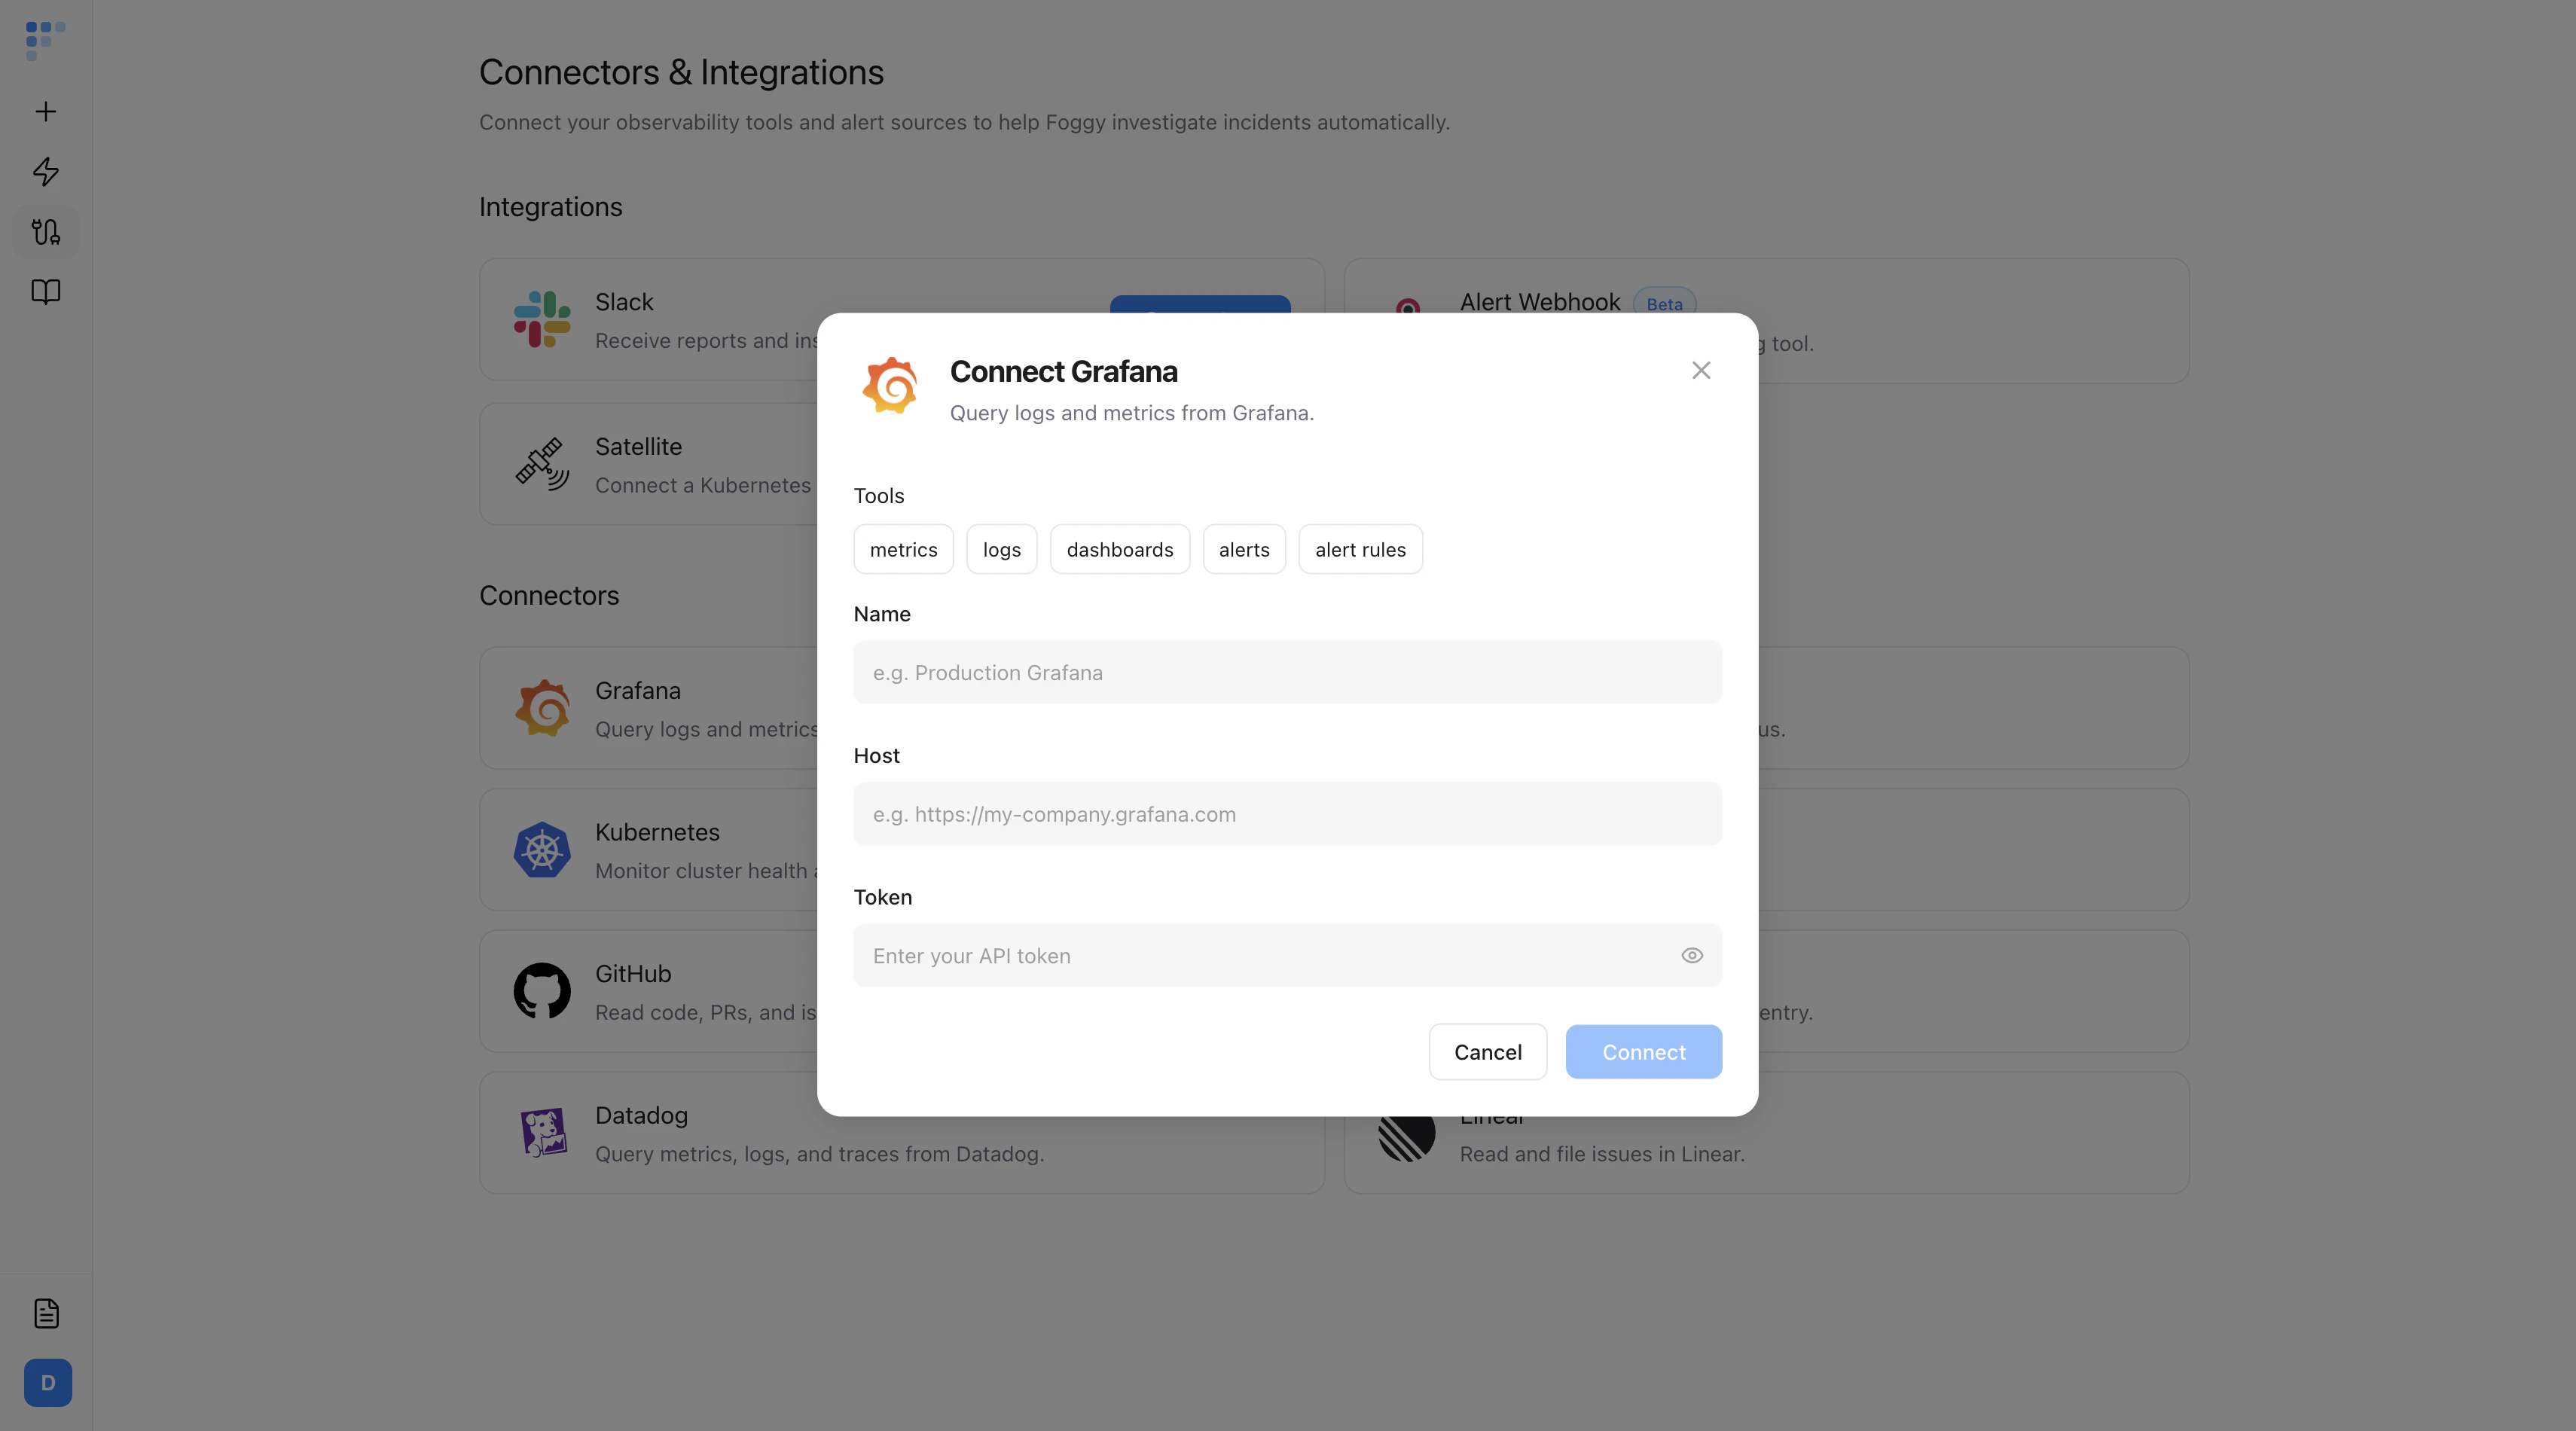
Go to **Connectors** → **Add Connector** → **Grafana** and fill in the form.
| Field | Required | Description |
| --------- | -------- | ---------------------------------------------------------------------------------------------------------------------------------------------------------------- |
| **Name** | Yes | A label for this connector (e.g. "Production Grafana") |
| **Host** | Yes | Your Grafana instance URL (e.g. `https://my-company.grafana.com`) |
| **Token** | No | API token for authenticated access. [Create a service account token](https://grafana.com/docs/grafana/latest/administration/service-accounts/) with Viewer role. |
 Foggy uses **read-only access**. Your data is never modified.
## Next steps
Set up scheduled and alert-triggered investigations that run automatically.
Auto-investigate when any alert fires — Grafana Alerts included.
Monitor cluster health, pod status, and events.
Investigate incidents and get results directly in Slack.
Foggy uses **read-only access**. Your data is never modified.
## Next steps
Set up scheduled and alert-triggered investigations that run automatically.
Auto-investigate when any alert fires — Grafana Alerts included.
Monitor cluster health, pod status, and events.
Investigate incidents and get results directly in Slack.